

Medical technology company Hologic (NASDAQ:HOLX) met Wall Street’s revenue expectations in Q1 CY2025, but sales fell by 1.2% year on year to $1.01 billion. On the other hand, next quarter’s revenue guidance of $1.01 billion was less impressive, coming in 2% below analysts’ estimates. Its non-GAAP profit of $1.03 per share was 1.4% above analysts’ consensus estimates.
Is now the time to buy Hologic? Find out by accessing our full research report, it’s free.
Hologic (HOLX) Q1 CY2025 Highlights:
- Revenue: $1.01 billion vs analyst estimates of $1.00 billion (1.2% year-on-year decline, in line)
- Adjusted EPS: $1.03 vs analyst estimates of $1.02 (1.4% beat)
- Adjusted EBITDA: $325.8 million vs analyst estimates of $324.9 million (32.4% margin, in line)
- The company reconfirmed its revenue guidance for the full year of $4.08 billion at the midpoint
- Management lowered its full-year Adjusted EPS guidance to $4.20 at the midpoint, a 2.3% decrease
- Operating Margin: -0.7%, down from 20.7% in the same quarter last year
- Free Cash Flow Margin: 15.3%, down from 26% in the same quarter last year
- Constant Currency Revenue was flat year on year, in line with the same quarter last year
- Market Capitalization: $13.06 billion
“We delivered on our financial commitments in the second quarter,” said Stephen P. MacMillan, the Company’s Chairman, President and Chief Executive Officer.
Company Overview
As a pioneer in 3D mammography technology that has revolutionized breast cancer detection, Hologic (NASDAQ:HOLX) develops and manufactures diagnostic products, medical imaging systems, and surgical devices focused primarily on women's health and wellness.
Sales Growth
A company’s long-term sales performance is one signal of its overall quality. Any business can put up a good quarter or two, but many enduring ones grow for years. Regrettably, Hologic’s sales grew at a tepid 3.9% compounded annual growth rate over the last five years. This fell short of our benchmark for the healthcare sector and is a rough starting point for our analysis.
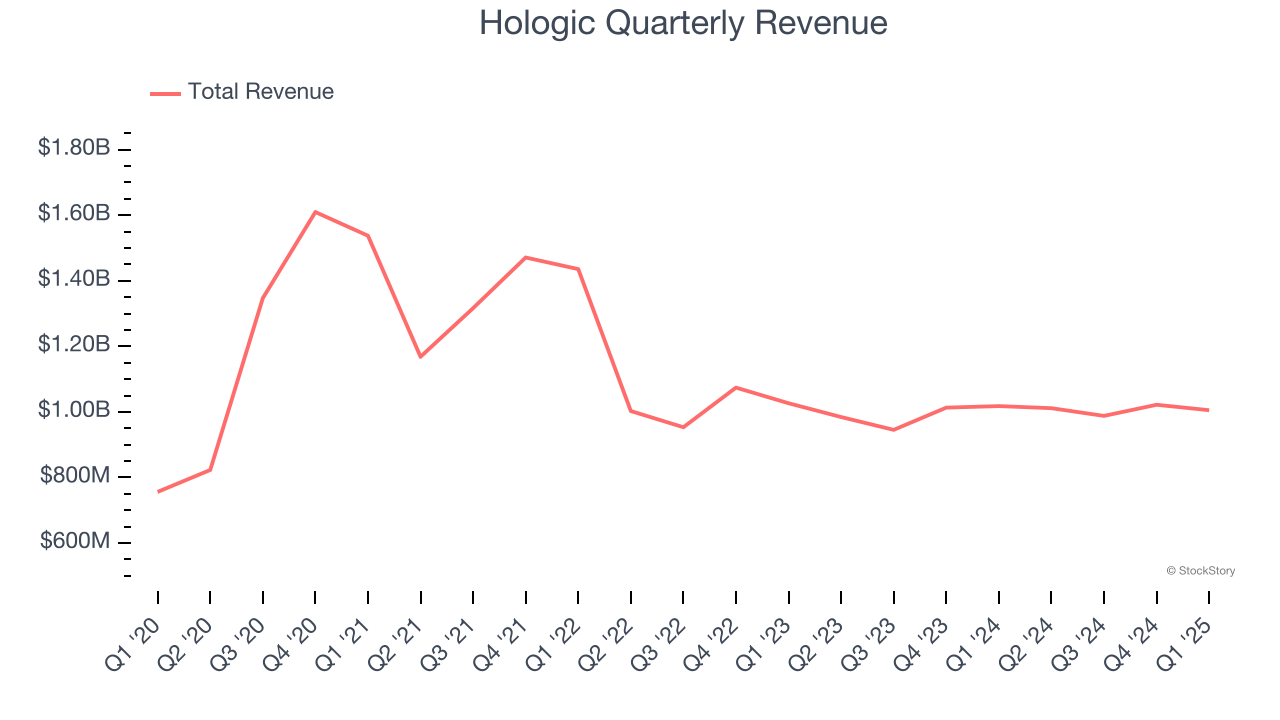
We at StockStory place the most emphasis on long-term growth, but within healthcare, a half-decade historical view may miss recent innovations or disruptive industry trends. Hologic’s recent performance shows its demand has slowed as its revenue was flat over the last two years. 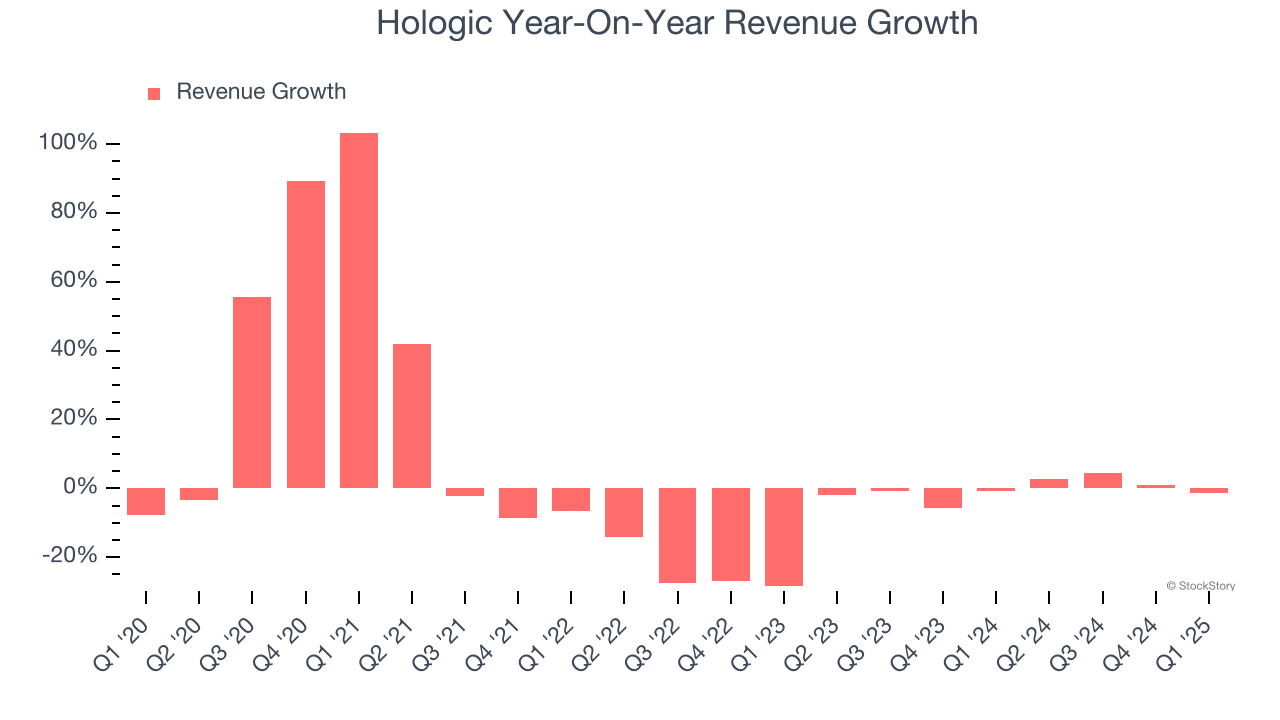
We can dig further into the company’s sales dynamics by analyzing its constant currency revenue, which excludes currency movements that are outside their control and not indicative of demand. Over the last two years, its constant currency sales were flat. Because this number aligns with its normal revenue growth, we can see that Hologic has properly hedged its foreign currency exposure. 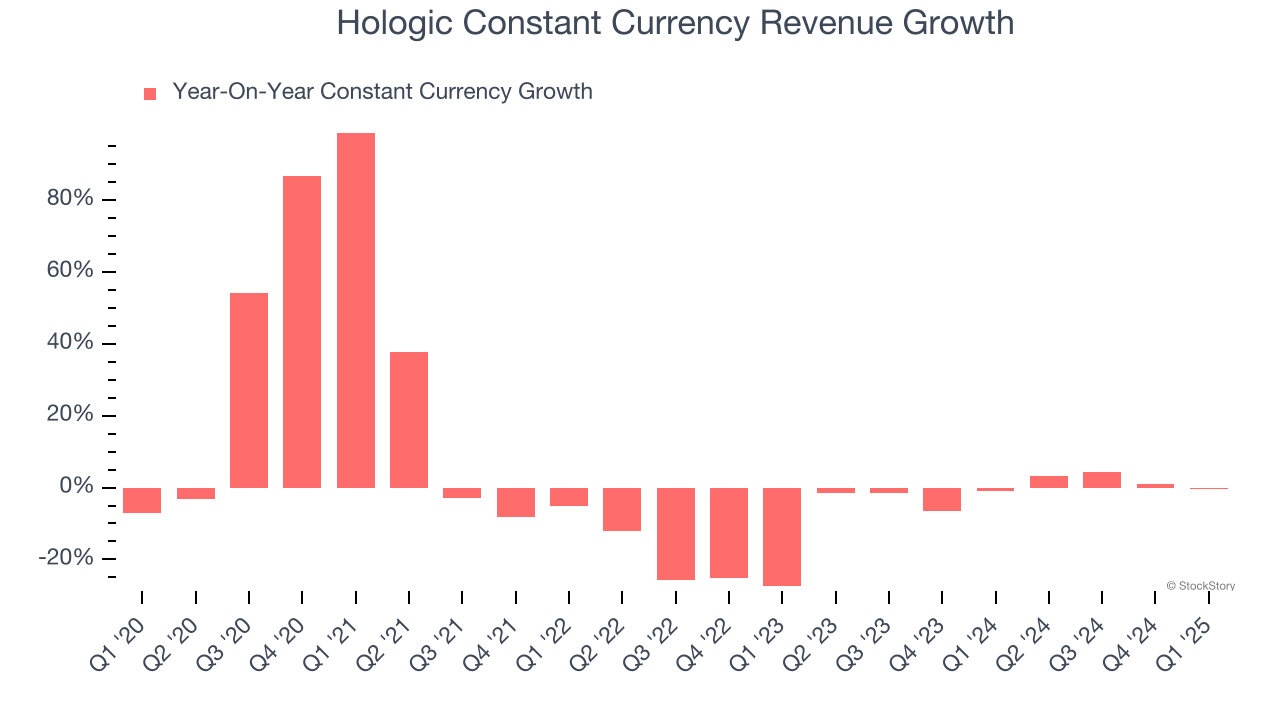
This quarter, Hologic reported a rather uninspiring 1.2% year-on-year revenue decline to $1.01 billion of revenue, in line with Wall Street’s estimates. Company management is currently guiding for flat sales next quarter.
Looking further ahead, sell-side analysts expect revenue to grow 3.8% over the next 12 months. While this projection indicates its newer products and services will catalyze better top-line performance, it is still below the sector average.
Software is eating the world and there is virtually no industry left that has been untouched by it. That drives increasing demand for tools helping software developers do their jobs, whether it be monitoring critical cloud infrastructure, integrating audio and video functionality, or ensuring smooth content streaming. Click here to access a free report on our 3 favorite stocks to play this generational megatrend.
Operating Margin
Hologic has been an efficient company over the last five years. It was one of the more profitable businesses in the healthcare sector, boasting an average operating margin of 29.5%.
Looking at the trend in its profitability, Hologic’s operating margin decreased by 29.8 percentage points over the last five years. The company’s two-year trajectory also shows it failed to get its profitability back to the peak as its margin fell by 5.8 percentage points. This performance was poor no matter how you look at it - it shows its expenses were rising and it couldn’t pass those costs onto its customers.
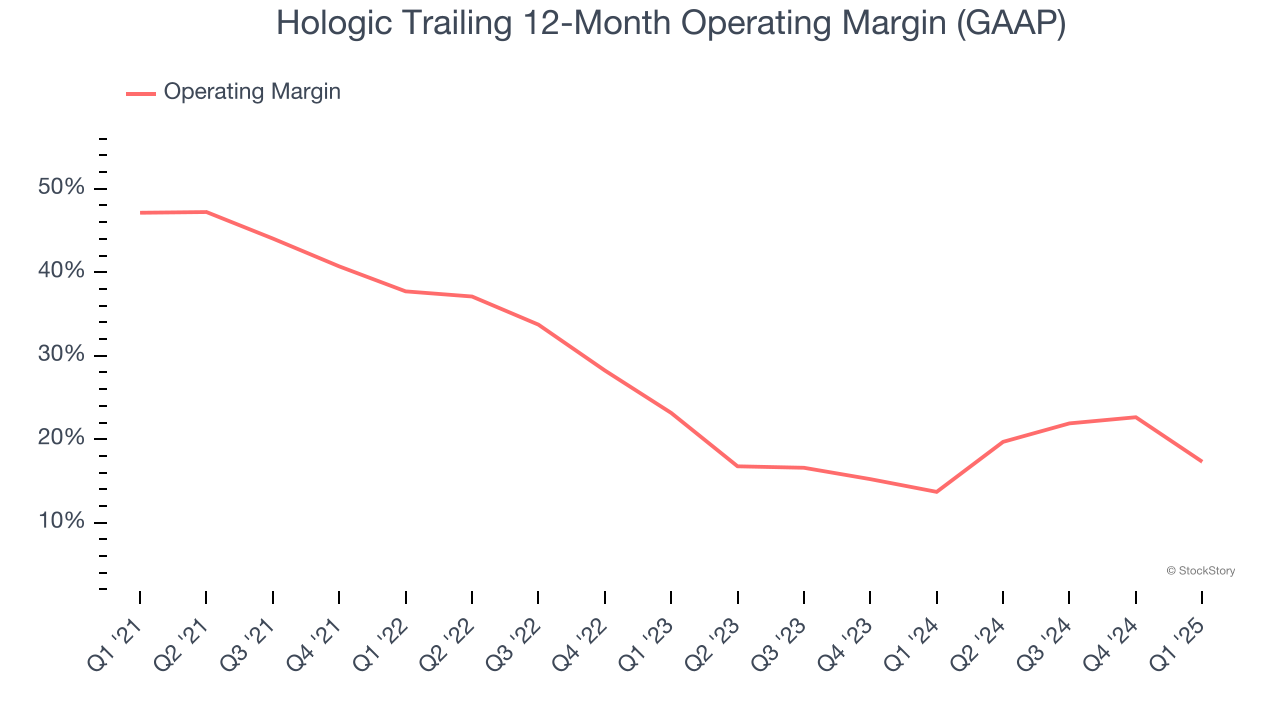
In Q1, Hologic’s breakeven margin was down 21.4 percentage points year on year. This contraction shows it was less efficient because its expenses increased relative to its revenue.
Earnings Per Share
We track the long-term change in earnings per share (EPS) for the same reason as long-term revenue growth. Compared to revenue, however, EPS highlights whether a company’s growth is profitable.
Hologic’s EPS grew at a remarkable 10.9% compounded annual growth rate over the last five years, higher than its 3.9% annualized revenue growth. However, this alone doesn’t tell us much about its business quality because its operating margin didn’t expand.
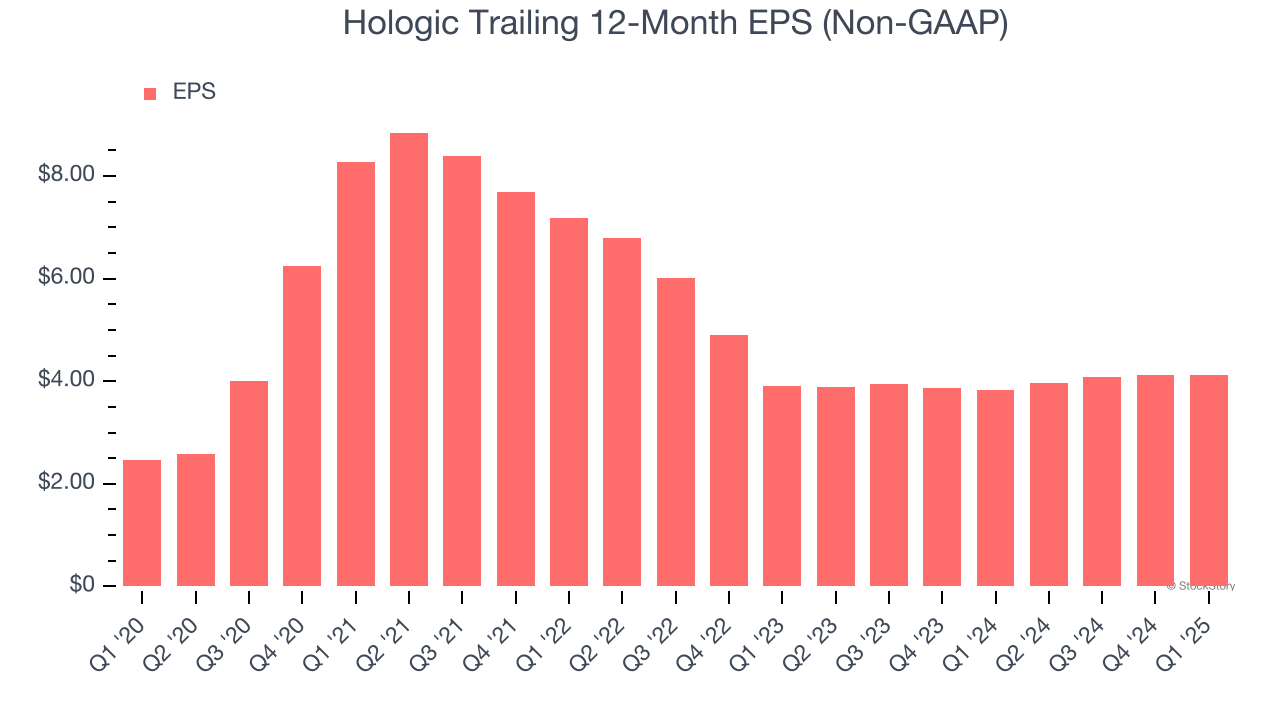
We can take a deeper look into Hologic’s earnings to better understand the drivers of its performance. A five-year view shows that Hologic has repurchased its stock, shrinking its share count by 14.6%. This tells us its EPS outperformed its revenue not because of increased operational efficiency but financial engineering, as buybacks boost per share earnings. 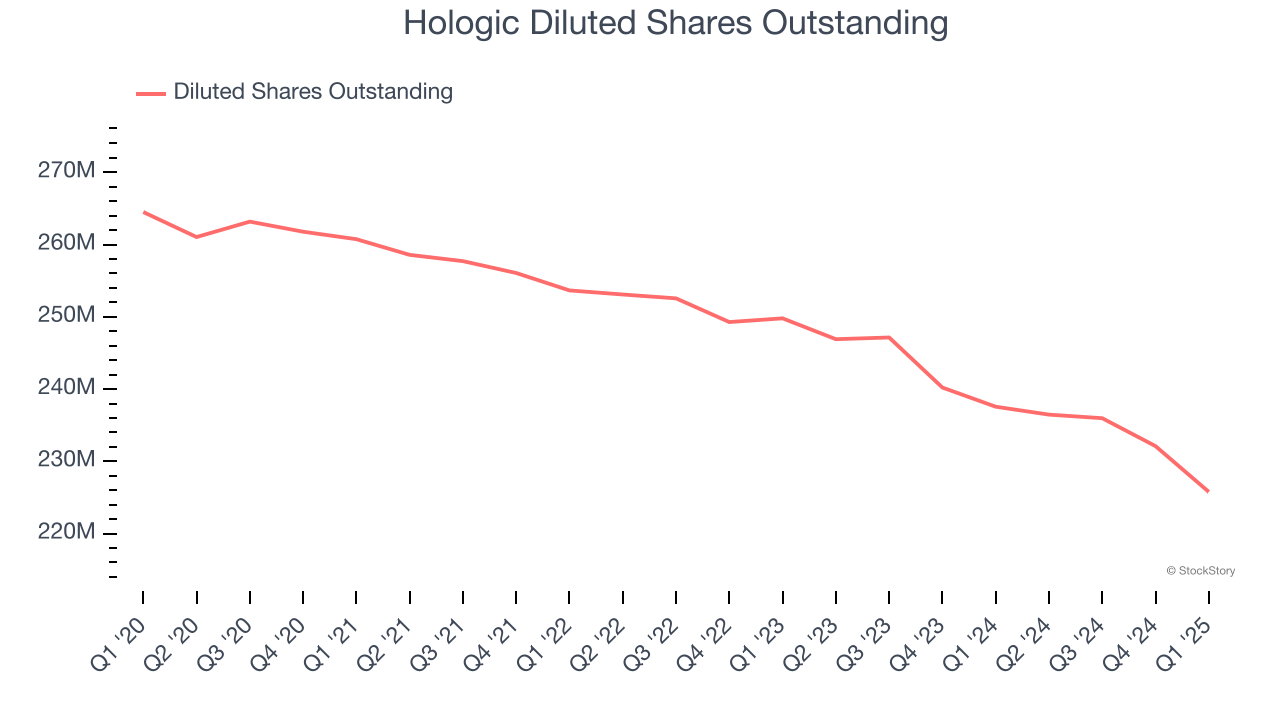
In Q1, Hologic reported EPS at $1.03, in line with the same quarter last year. This print beat analysts’ estimates by 1.4%. Over the next 12 months, Wall Street expects Hologic’s full-year EPS of $4.13 to grow 7.6%.
Key Takeaways from Hologic’s Q1 Results
We struggled to find many positives in these results. Its revenue guidance for next quarter missed significantly and its EPS guidance for next quarter fell short of Wall Street’s estimates. Overall, this was a softer quarter. The stock traded down 2.2% to $56 immediately after reporting.
The latest quarter from Hologic’s wasn’t that good. One earnings report doesn’t define a company’s quality, though, so let’s explore whether the stock is a buy at the current price. What happened in the latest quarter matters, but not as much as longer-term business quality and valuation, when deciding whether to invest in this stock. We cover that in our actionable full research report which you can read here, it’s free.